Revenue, appointments, patients and clients — all at a glance

How much have you invoiced this month? Which day of the week is most in demand? How many patients come back regularly — and who hasn’t had an appointment in over six months?
From now on you’ll find answers to all these questions directly in TheraTap: with the new Analytics page.
Highlights at a glance
- Revenue & Finances — invoiced, collected, outstanding, overdue
- Appointments & Utilisation — trend comparison, heatmap, weekday analysis
- Patients & Retention — species distribution, age structure, reactivation list
- Clients & Catchment Area — geographic map, top clients by revenue
- Therapist Comparison — for practices with multiple therapists
Revenue & Finances
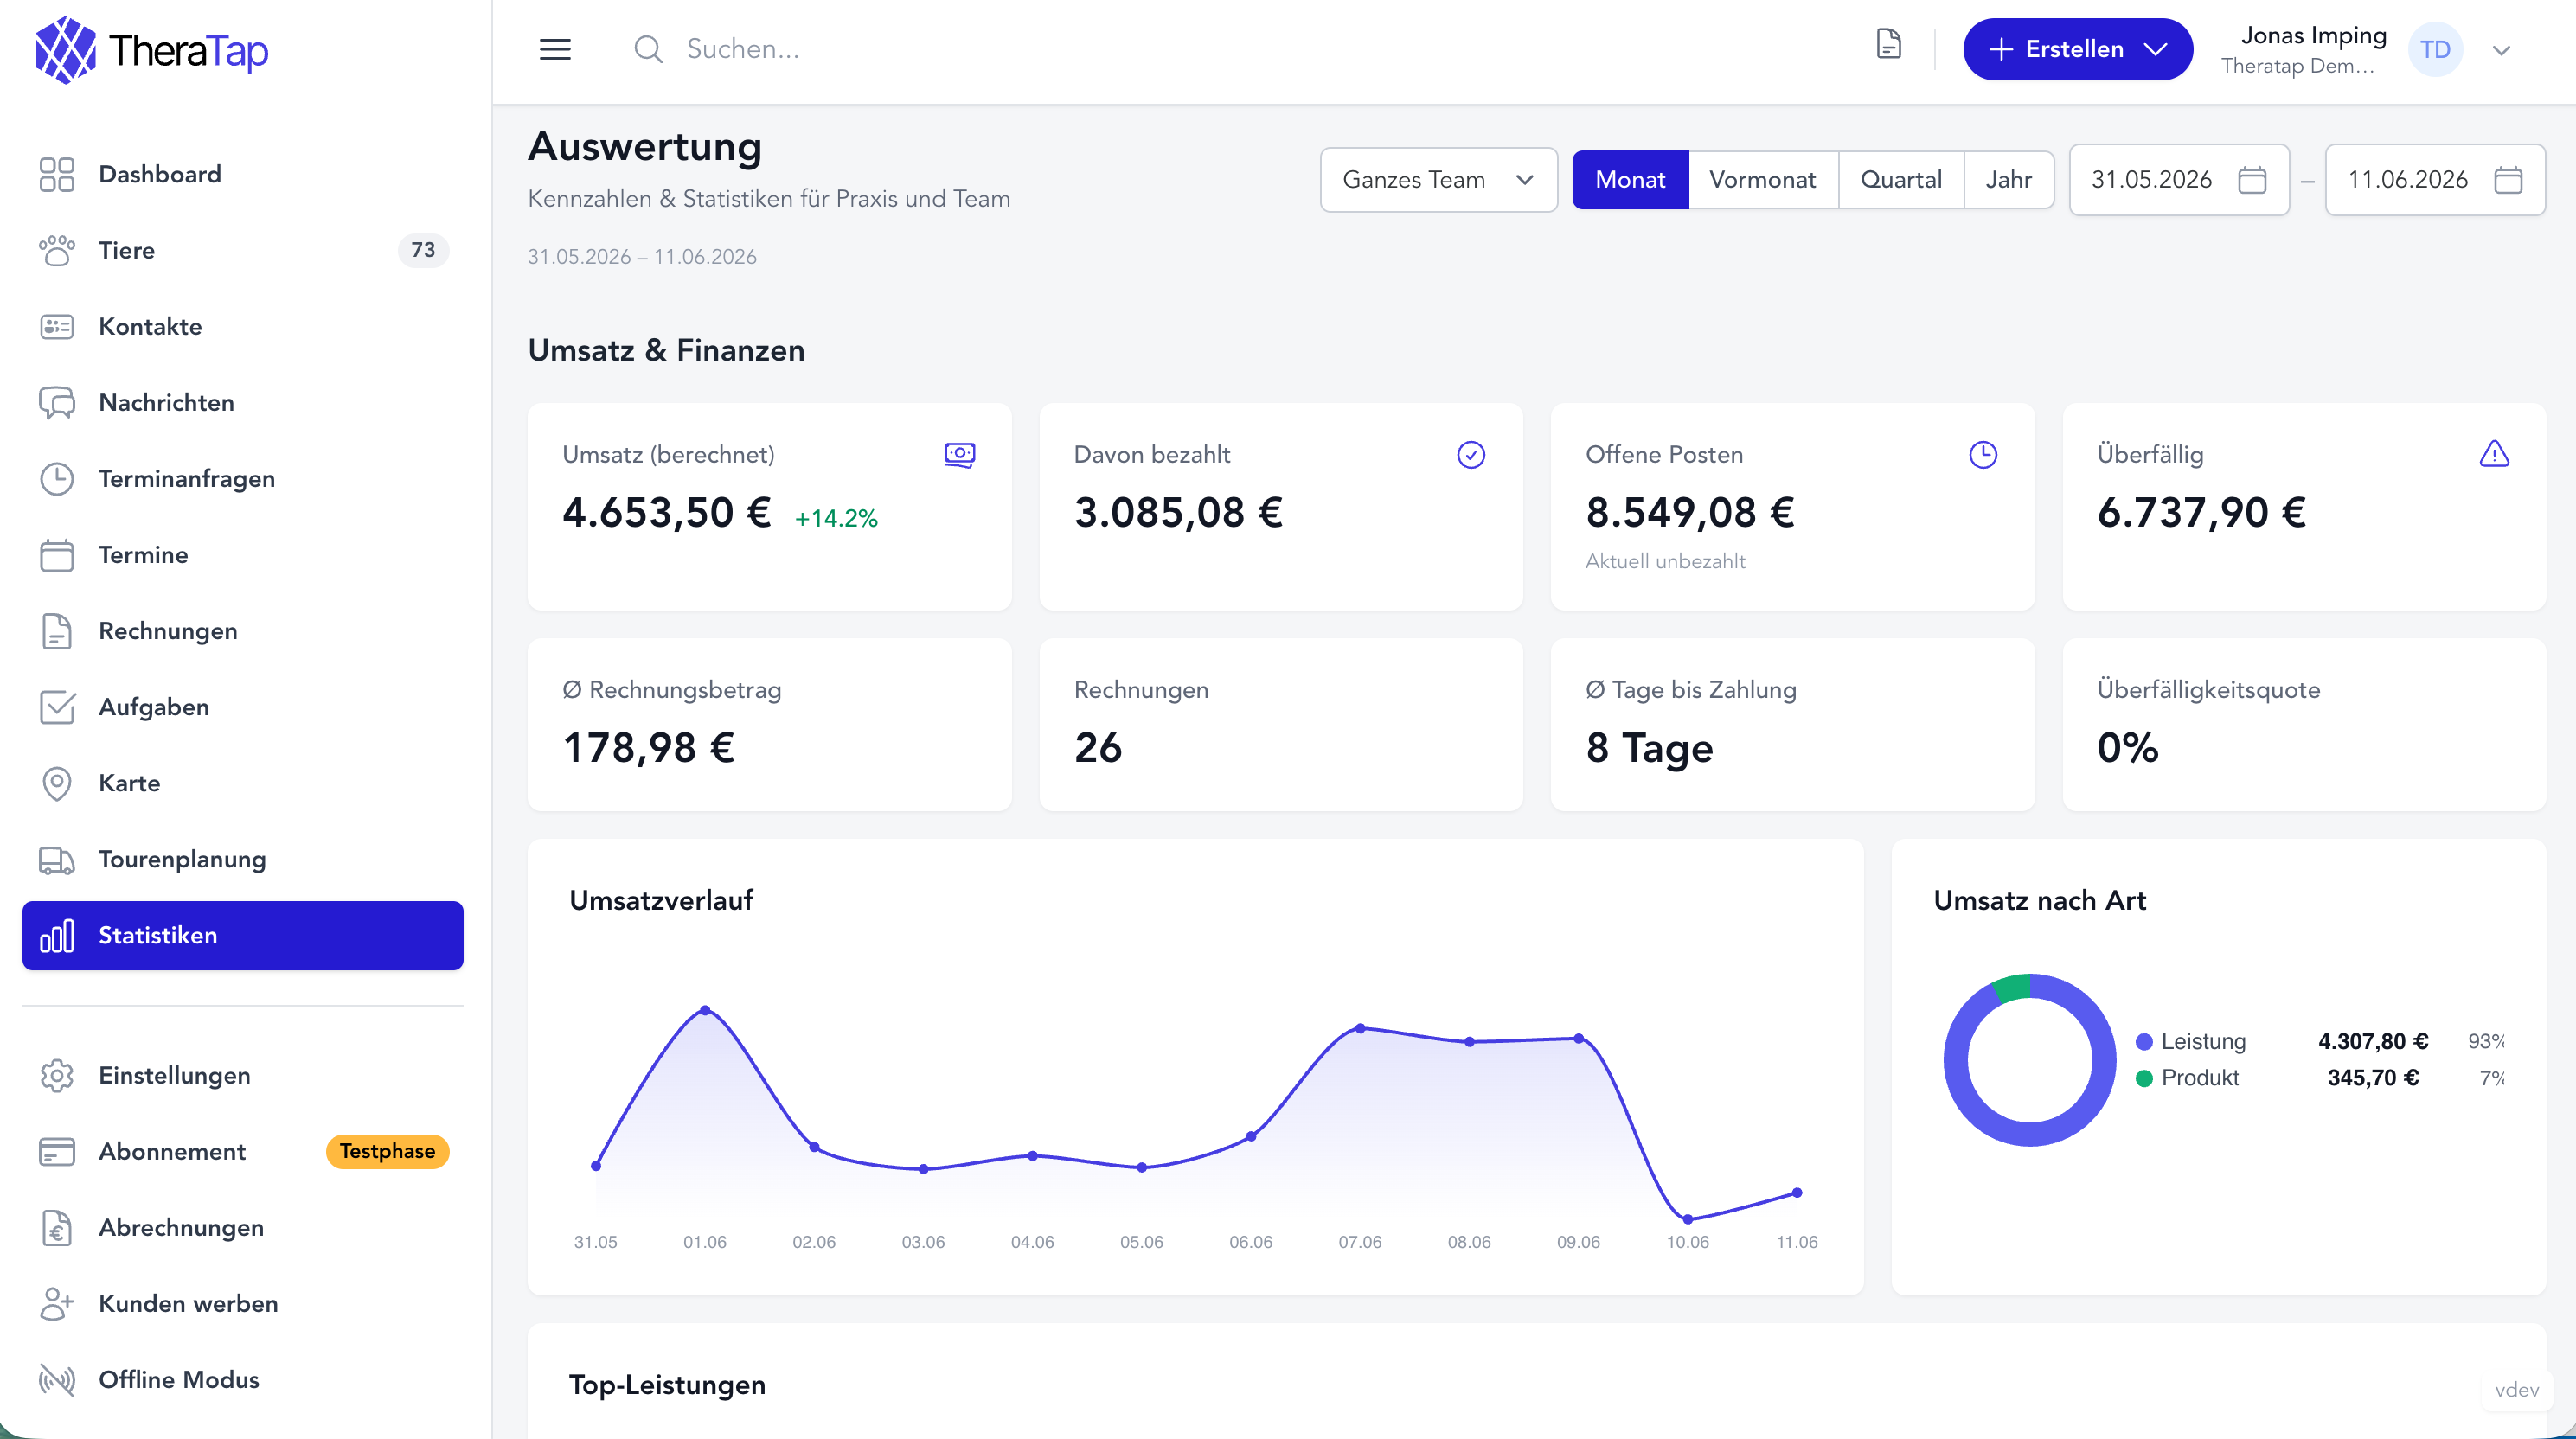
The first section gives you an instant view of what you’ve invoiced and actually received during the selected period — and what’s still outstanding.
- Invoiced revenue with trend arrow compared to the previous period
- Collected — your actual payments received
- Outstanding and overdue invoices
- Avg. invoice amount, number of invoices and avg. days to payment
- Revenue trend as a line chart
- Revenue by type (services, products, appointments) as a donut chart
- Top services — which line items you invoice most often and how much they generate
The payment behaviour metrics are especially useful for spotting clients you should follow up with earlier.
Appointments & Utilisation
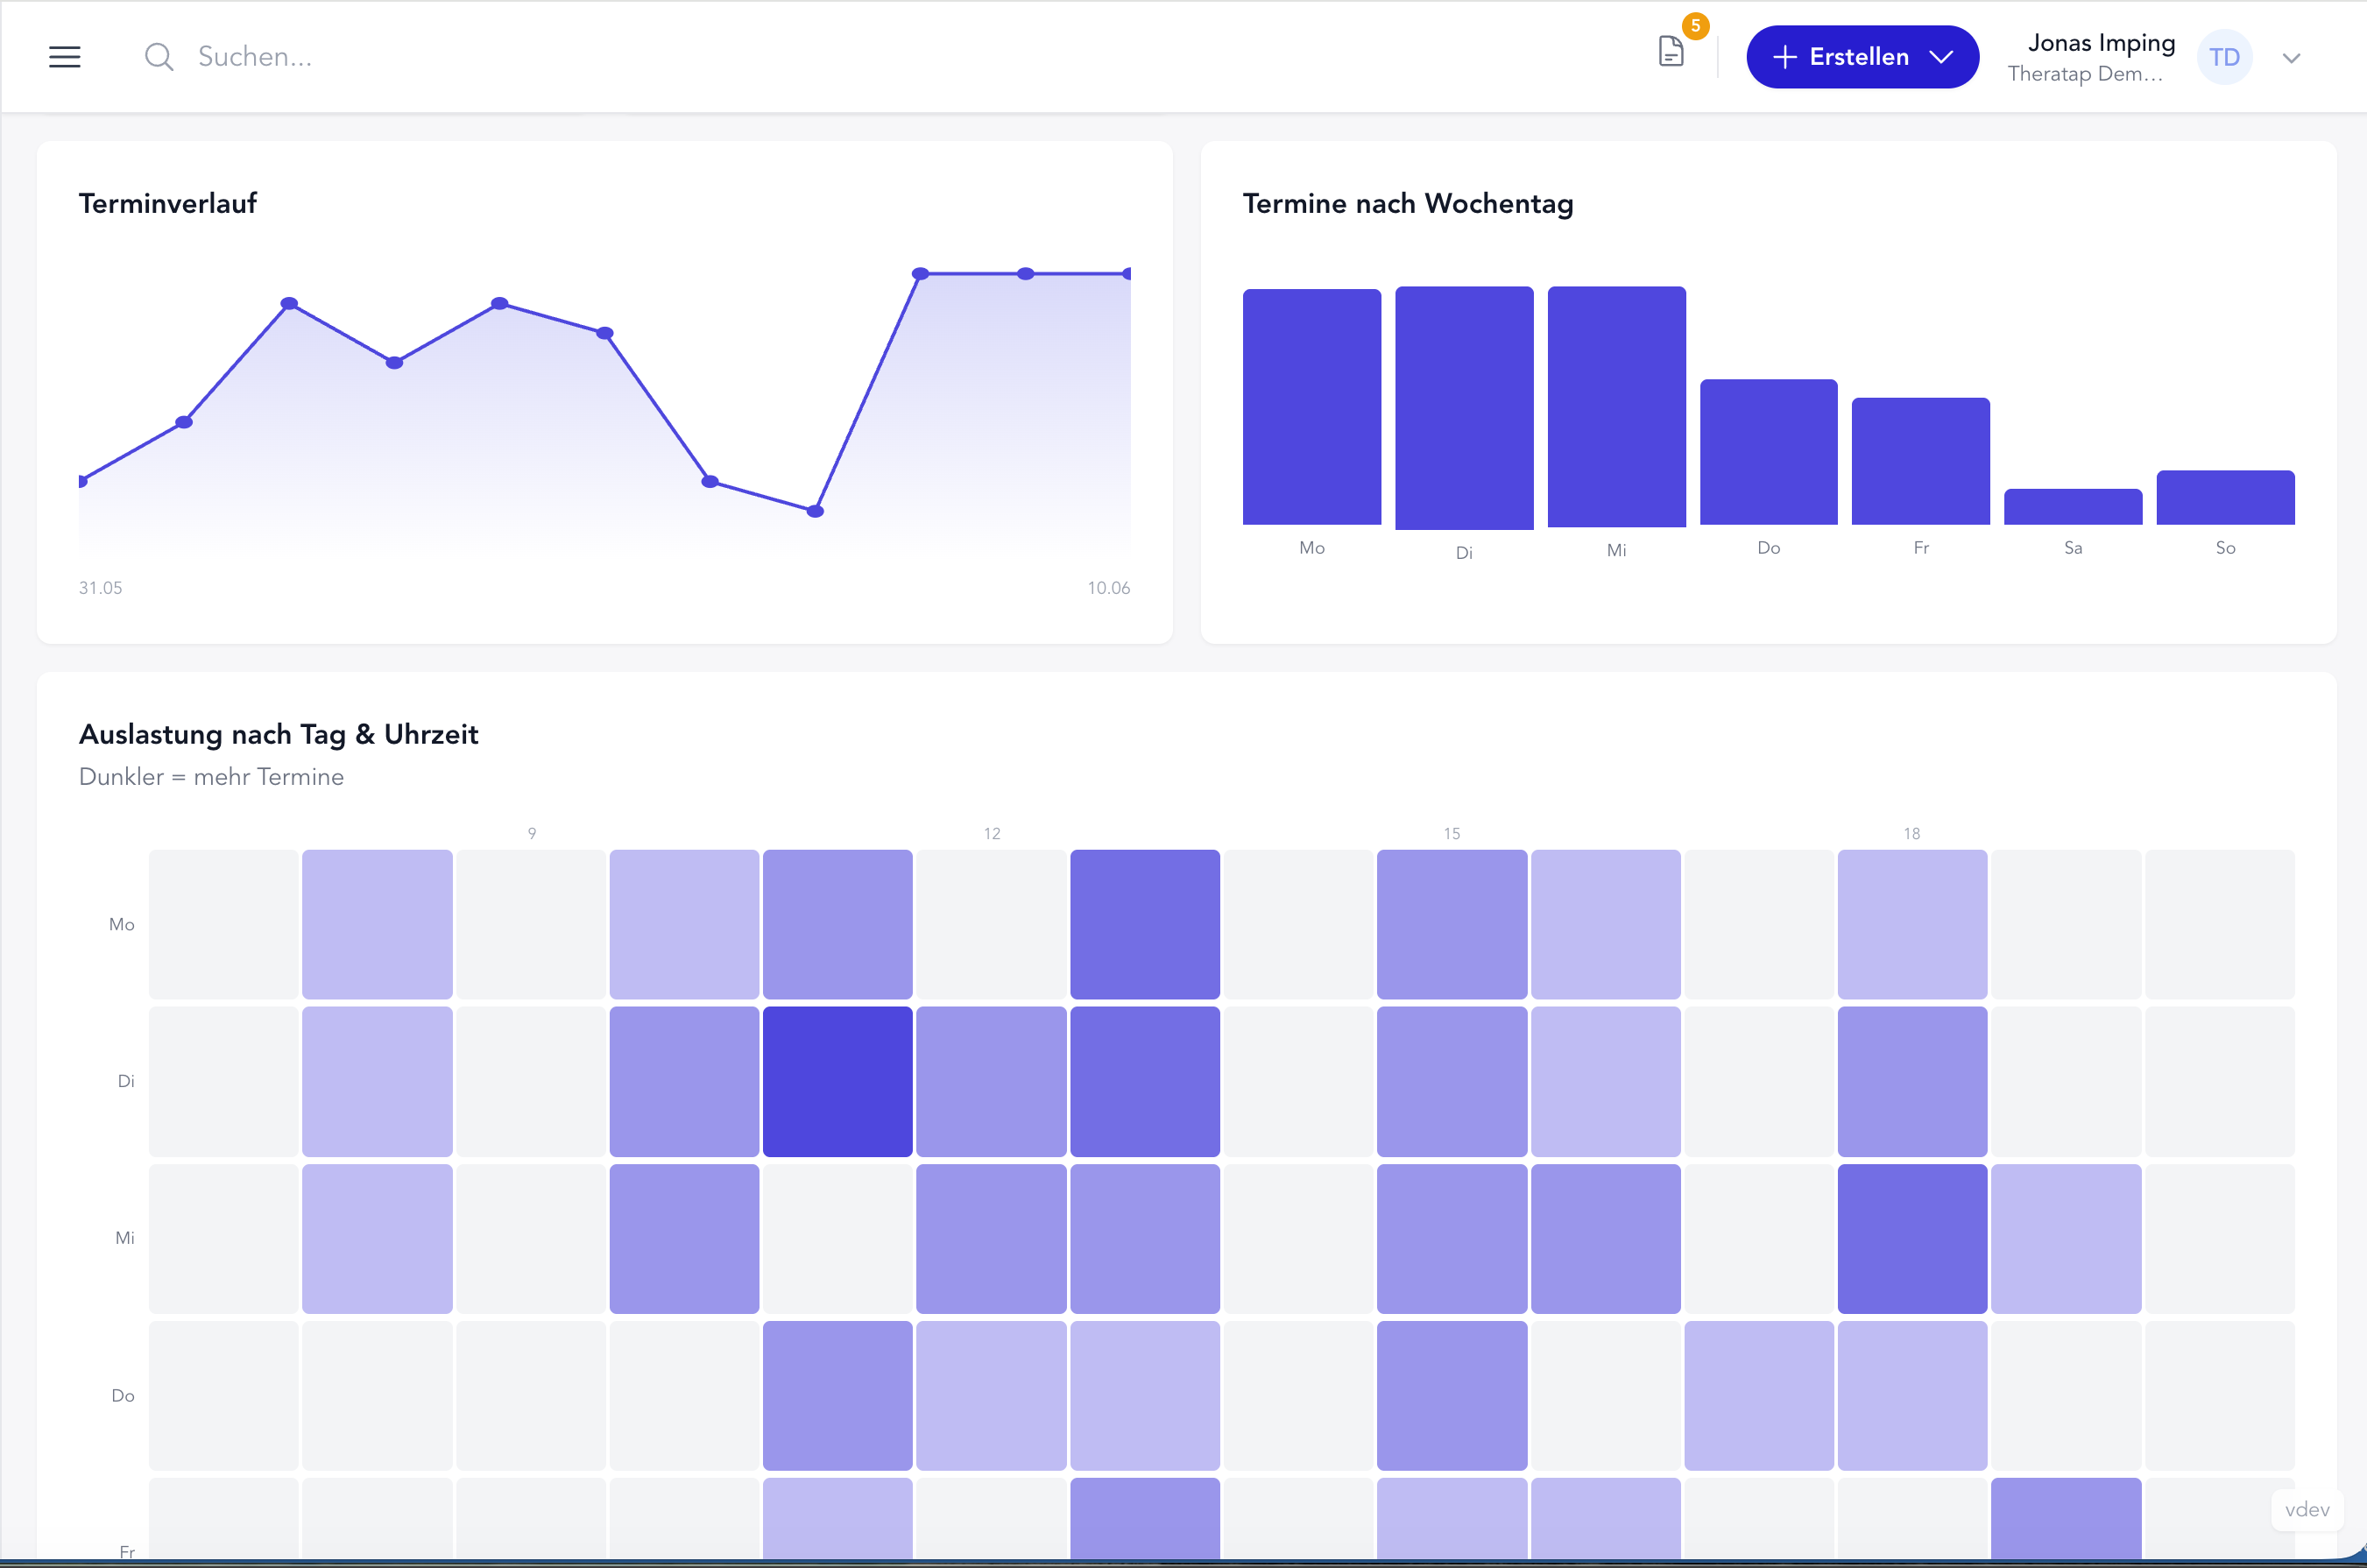
How evenly are your appointments actually spread? The second section shows:
- Total appointments with trend comparison to the previous month or quarter
- Utilisation percentage (if you’ve set up capacity hours)
- Cancellation rate, avg. appointment duration and avg. lead time
- Appointment trend as a line chart
- Appointments by weekday as a bar chart
- Heatmap by day and time — see at a glance when your calendar is most packed
The heatmap is particularly helpful when you want to adjust your online booking windows or your availability.
Patients & Retention
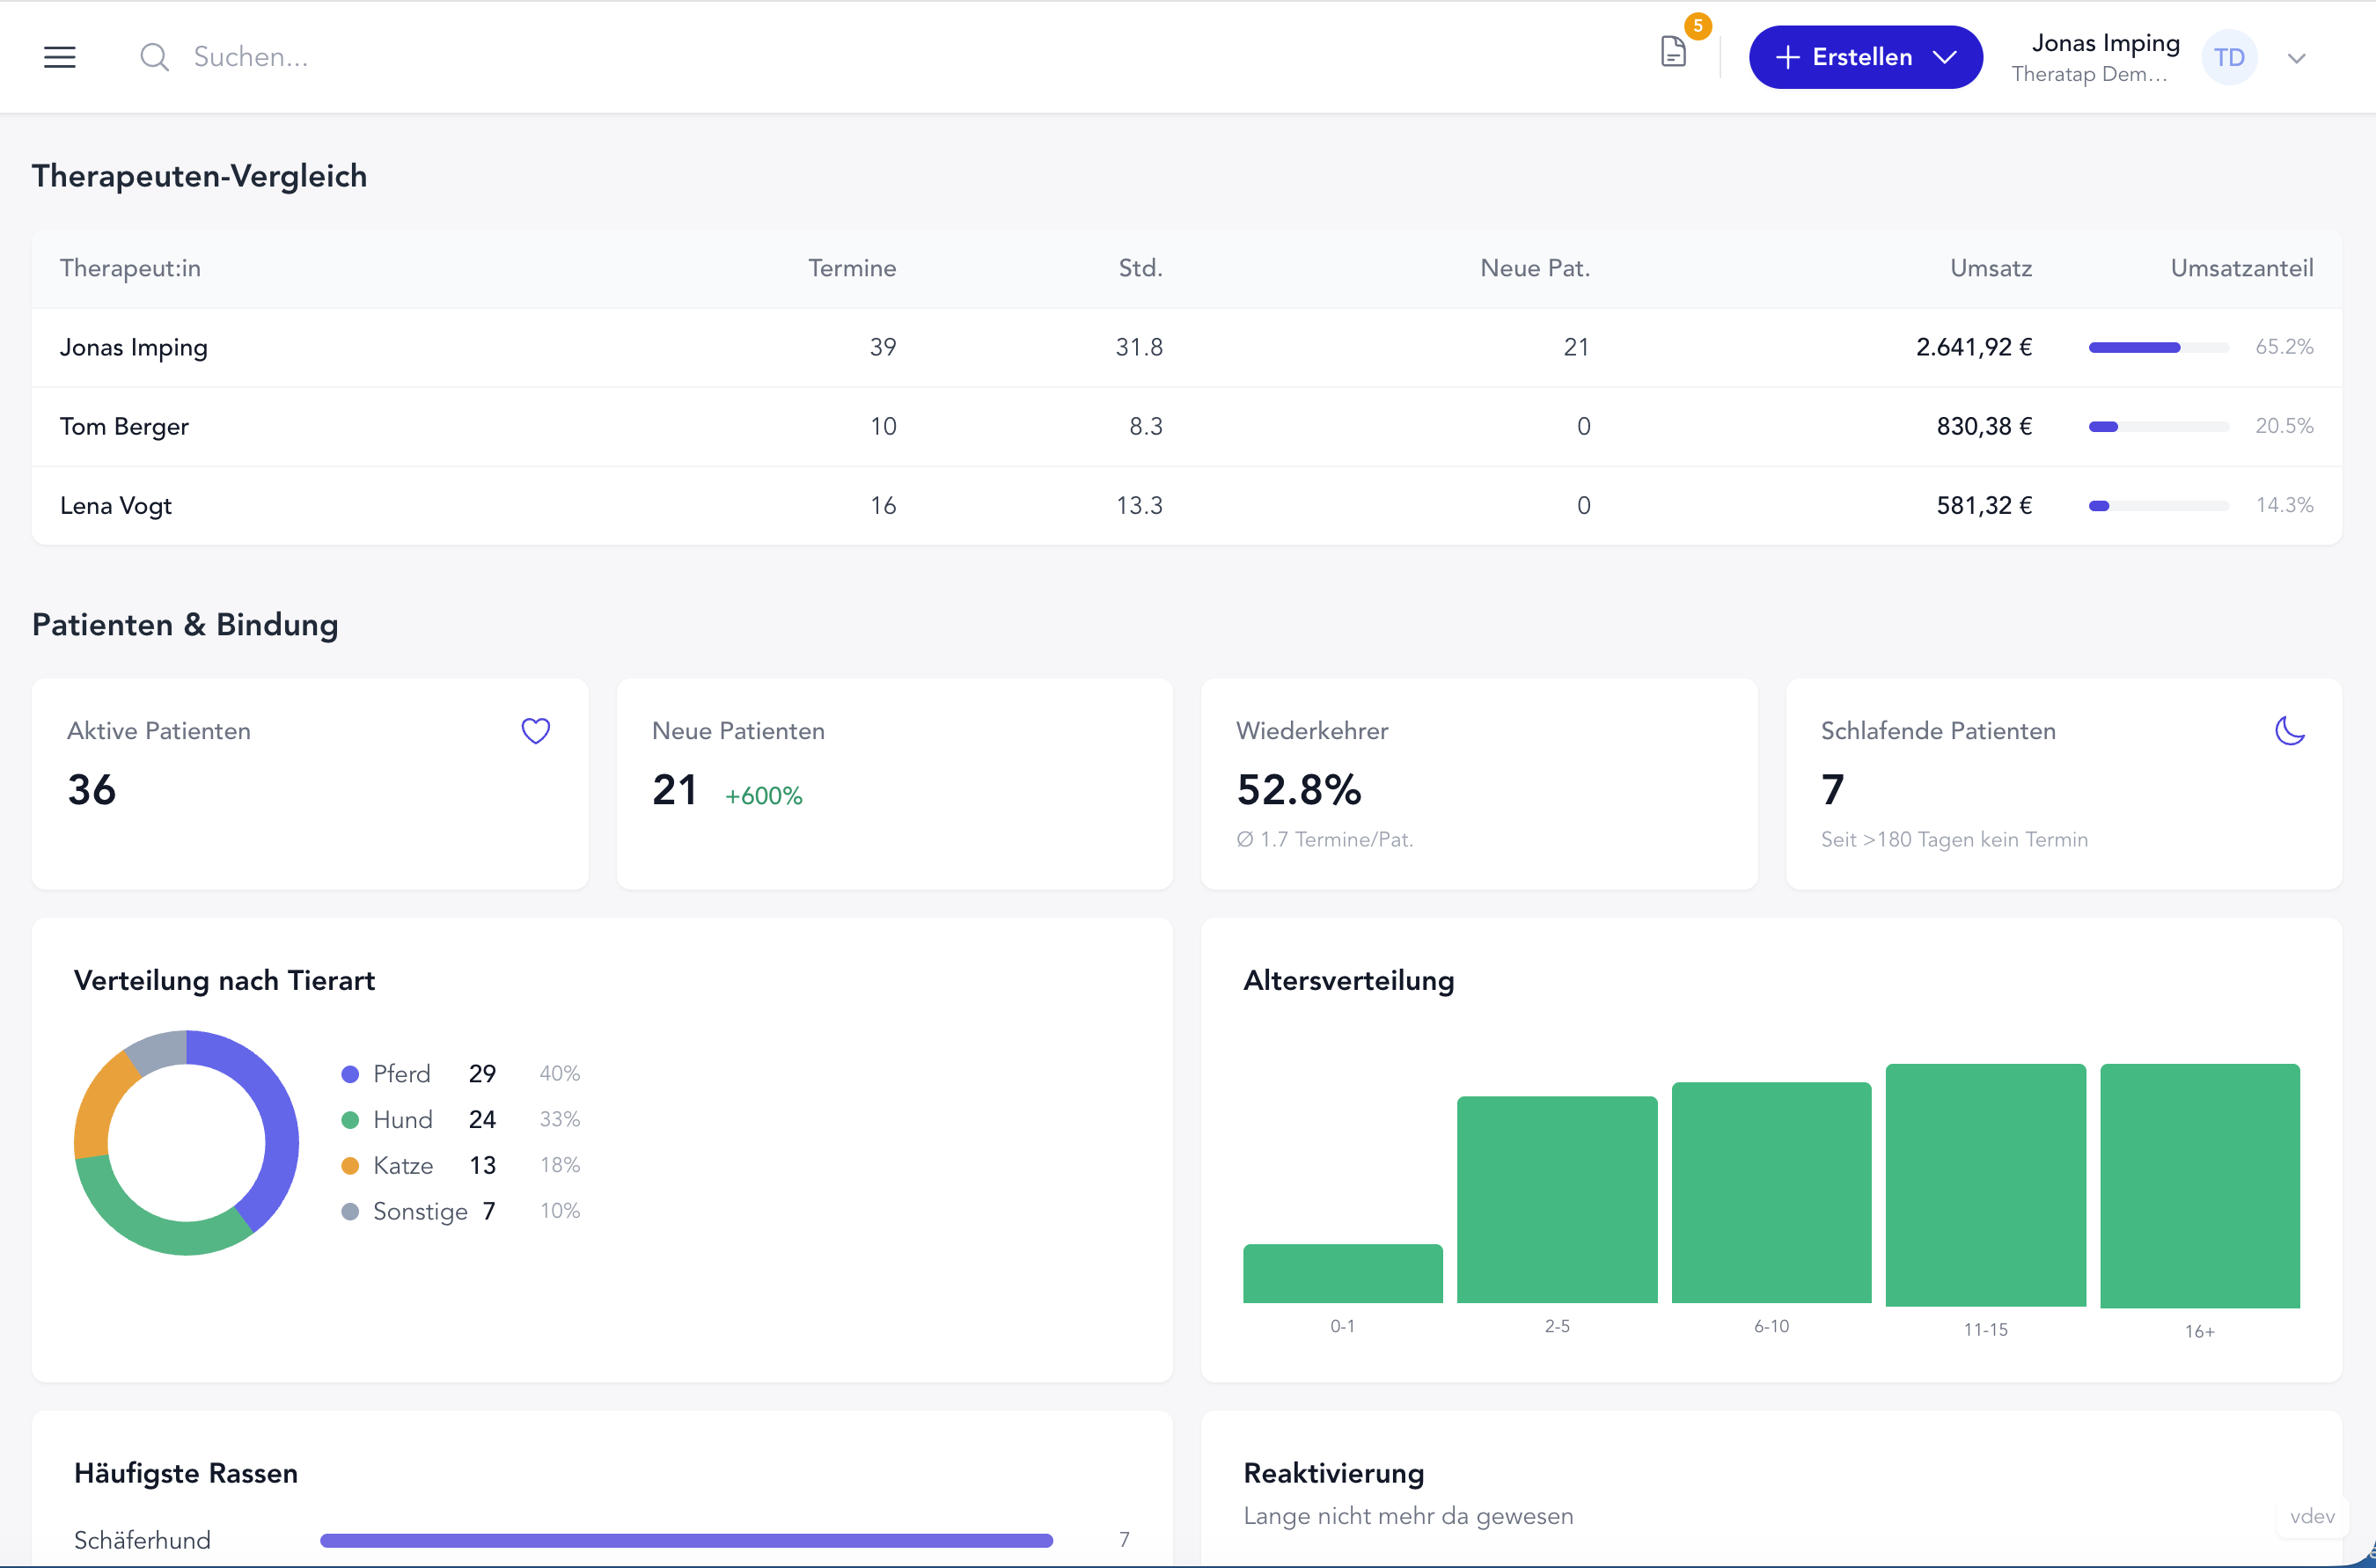
Is your practice growing? Do patients come back? This section gives you insight into your patient structure:
- Active, new and dormant patients (no appointment in > 180 days)
- Return rate and avg. appointments per patient
- Species distribution (horse, dog, cat, other)
- Age distribution and most common breeds
- Reactivation list — a direct list of patients who haven’t been in for a long time, one click to the patient record
The reactivation list is a small but powerful feature: you see at a glance who you could proactively reach out to.
Clients & Catchment Area
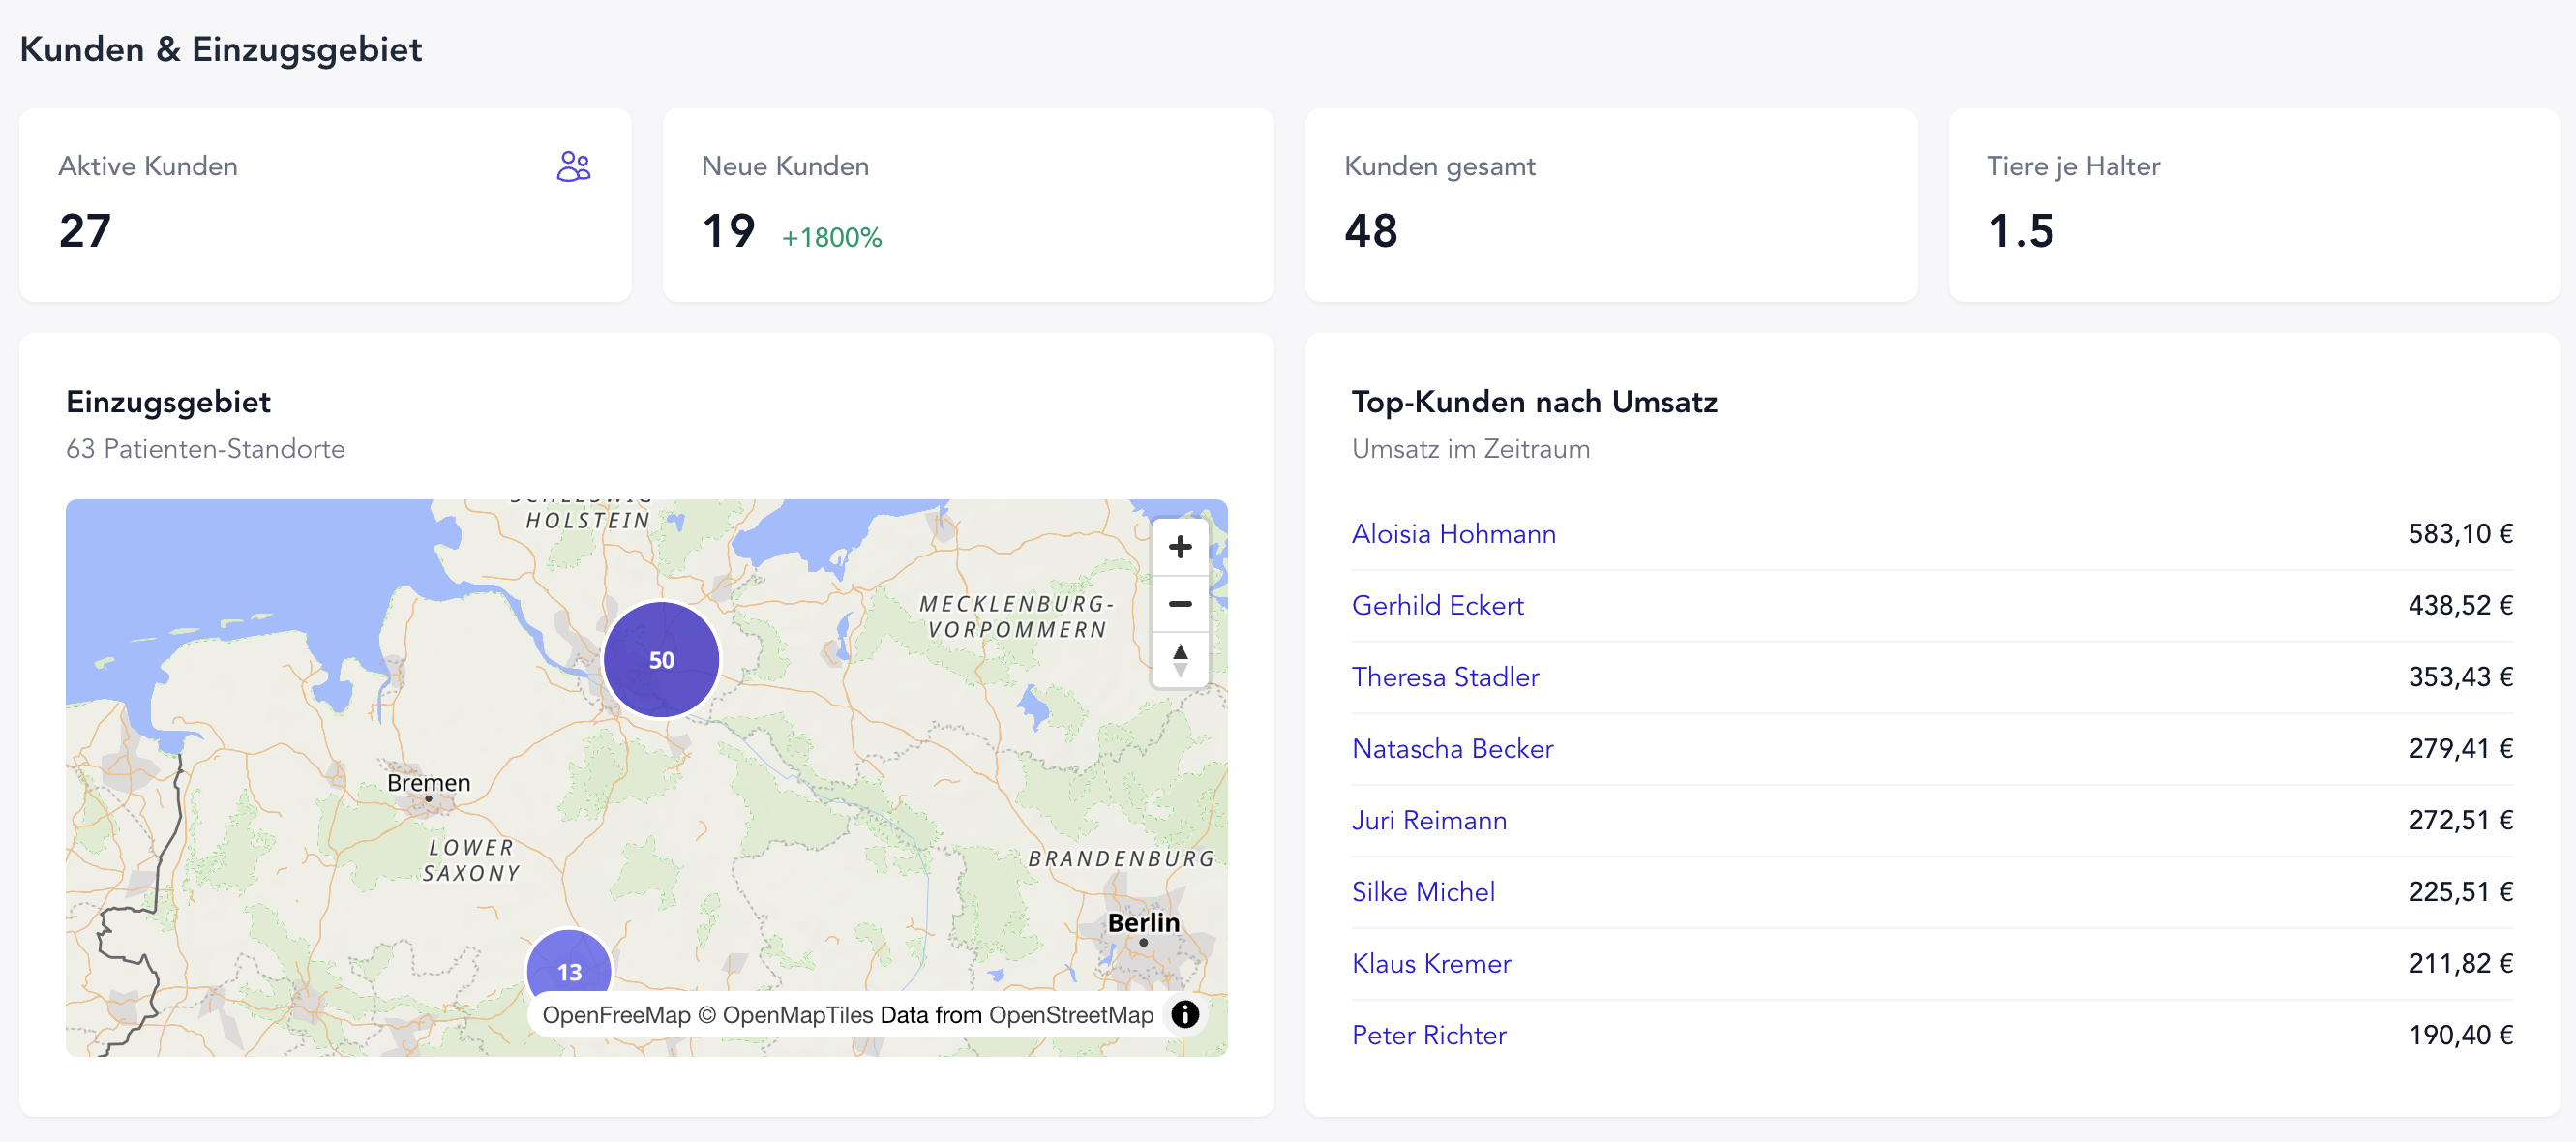
Where do your clients come from? How many animals does a pet owner bring on average?
- Active, new and total clients
- Avg. animals per client
- Geographic map with all registered client locations — see your catchment area at a glance
- Top clients by revenue for the selected period
Therapist Comparison
For practices with multiple therapists: the team comparison shows appointments, hours, new patients, revenue and each person’s revenue share — all in a clear table.
You can also filter the entire analytics view by a single therapist.
Flexible time periods
Choose from four quick presets:
- Month — current month
- Last month — previous month
- Quarter — current quarter
- Year — current calendar year
Or pick a custom date range with a start and end date. All metrics with a trend arrow are automatically compared against the equally long preceding period.
The new Analytics page is available immediately for all accounts.
Questions or feedback? Get in touch — we’d love to hear from you!